Are you trying to conceive or wondering if you might be pregnant? Your (Basal Body Temperature) BBT chart can tell you a lot about your fertility, especially whether you are pregnant or not. From understanding the basics of when BBT drops or rises and how to interpret your chart, we can uncover everything you need to know to use this powerful tool on your fertility journey.
What is basal body temperature?
Basal Body Temperature (BBT) is the lowest temperature of your body at complete rest. BBT changes throughout the menstrual cycle, reflecting fluctuations in hormone levels. During the first half of the cycle, estrogen dominates and causes the body to produce more cervical mucus, which creates a lower, more stable BBT.
After ovulation, progesterone takes over and causes a slight increase in temperature. Resting temperature is best measured first thing when you wake up in the morning, before you get out of bed, eat, drink, walk, or talk.
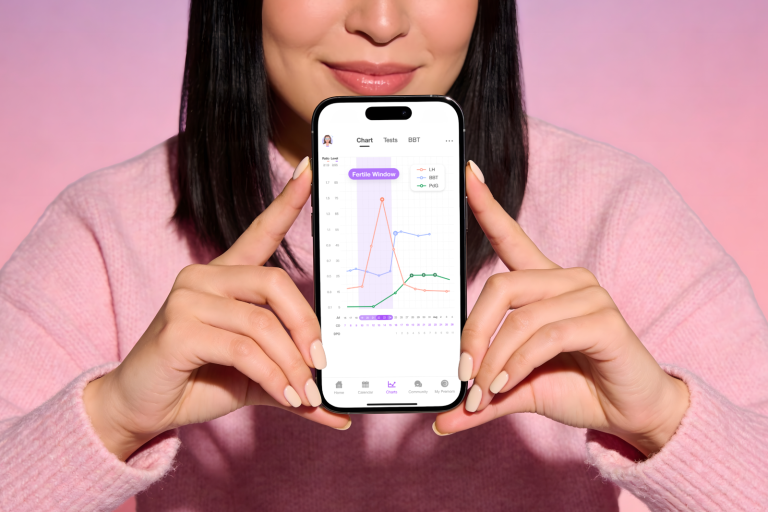
A typical BBT chart shows a biphasic pattern:
- Follicular phase → lower temperatures before ovulation
- Luteal phase → higher temperatures after ovulation
This shift happens because estrogen lowers temperature in the first half of your cycle, while progesterone increases temperature after ovulation. This temperature shift shows up consistently enough to be considered a reliable signal in fertility tracking and natural family planning methods.
How to use BBT to know if you have ovulated
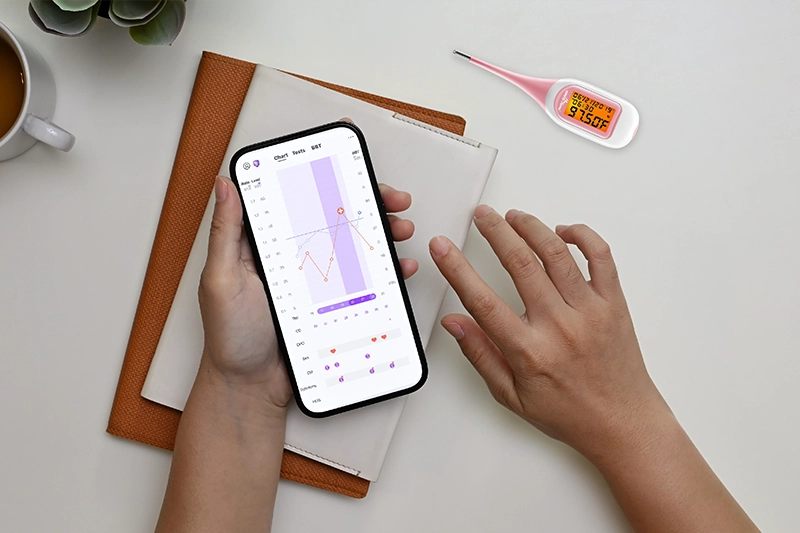
Throughout a woman’s cycle, BBT typically follows a pattern—lower temperatures before ovulation, followed by a rise afterward due to hormonal changes. Specifically, as progesterone increases after ovulation, BBT rises by about 0.5 – 1ºF (0.3 – 0.6ºC). To track this, you’ll need a basal thermometer and should take your temperature each morning right when you wake up.
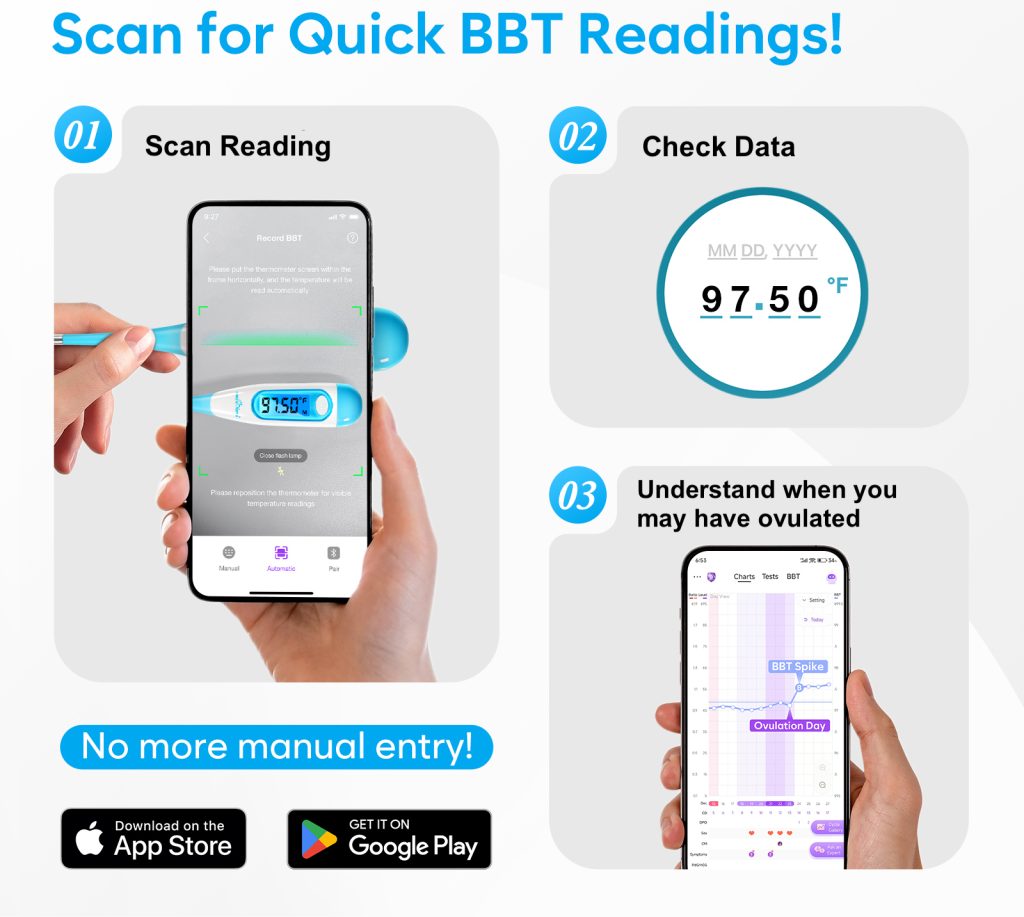
Tracking manually can be tricky, but using an app like Premom makes it much easier by recording and charting your temperatures. With consistent tracking, you may notice a temperature shift that tends to occur 1-3 days after ovulation. This shift, known as the BBT Spike, can help you feel more confident that ovulation has likely occurred for that cycle.
If you’re using a regular digital basal thermometer, Premom’s unique Auto-Scan feature lets you log your temperature in seconds—just scan your thermometer with your phone’s camera and you’re done. It’s one of the fastest and simplest ways to record and track your basal temperature.
BBT vs ovulation tests (OPKs): What’s the difference?
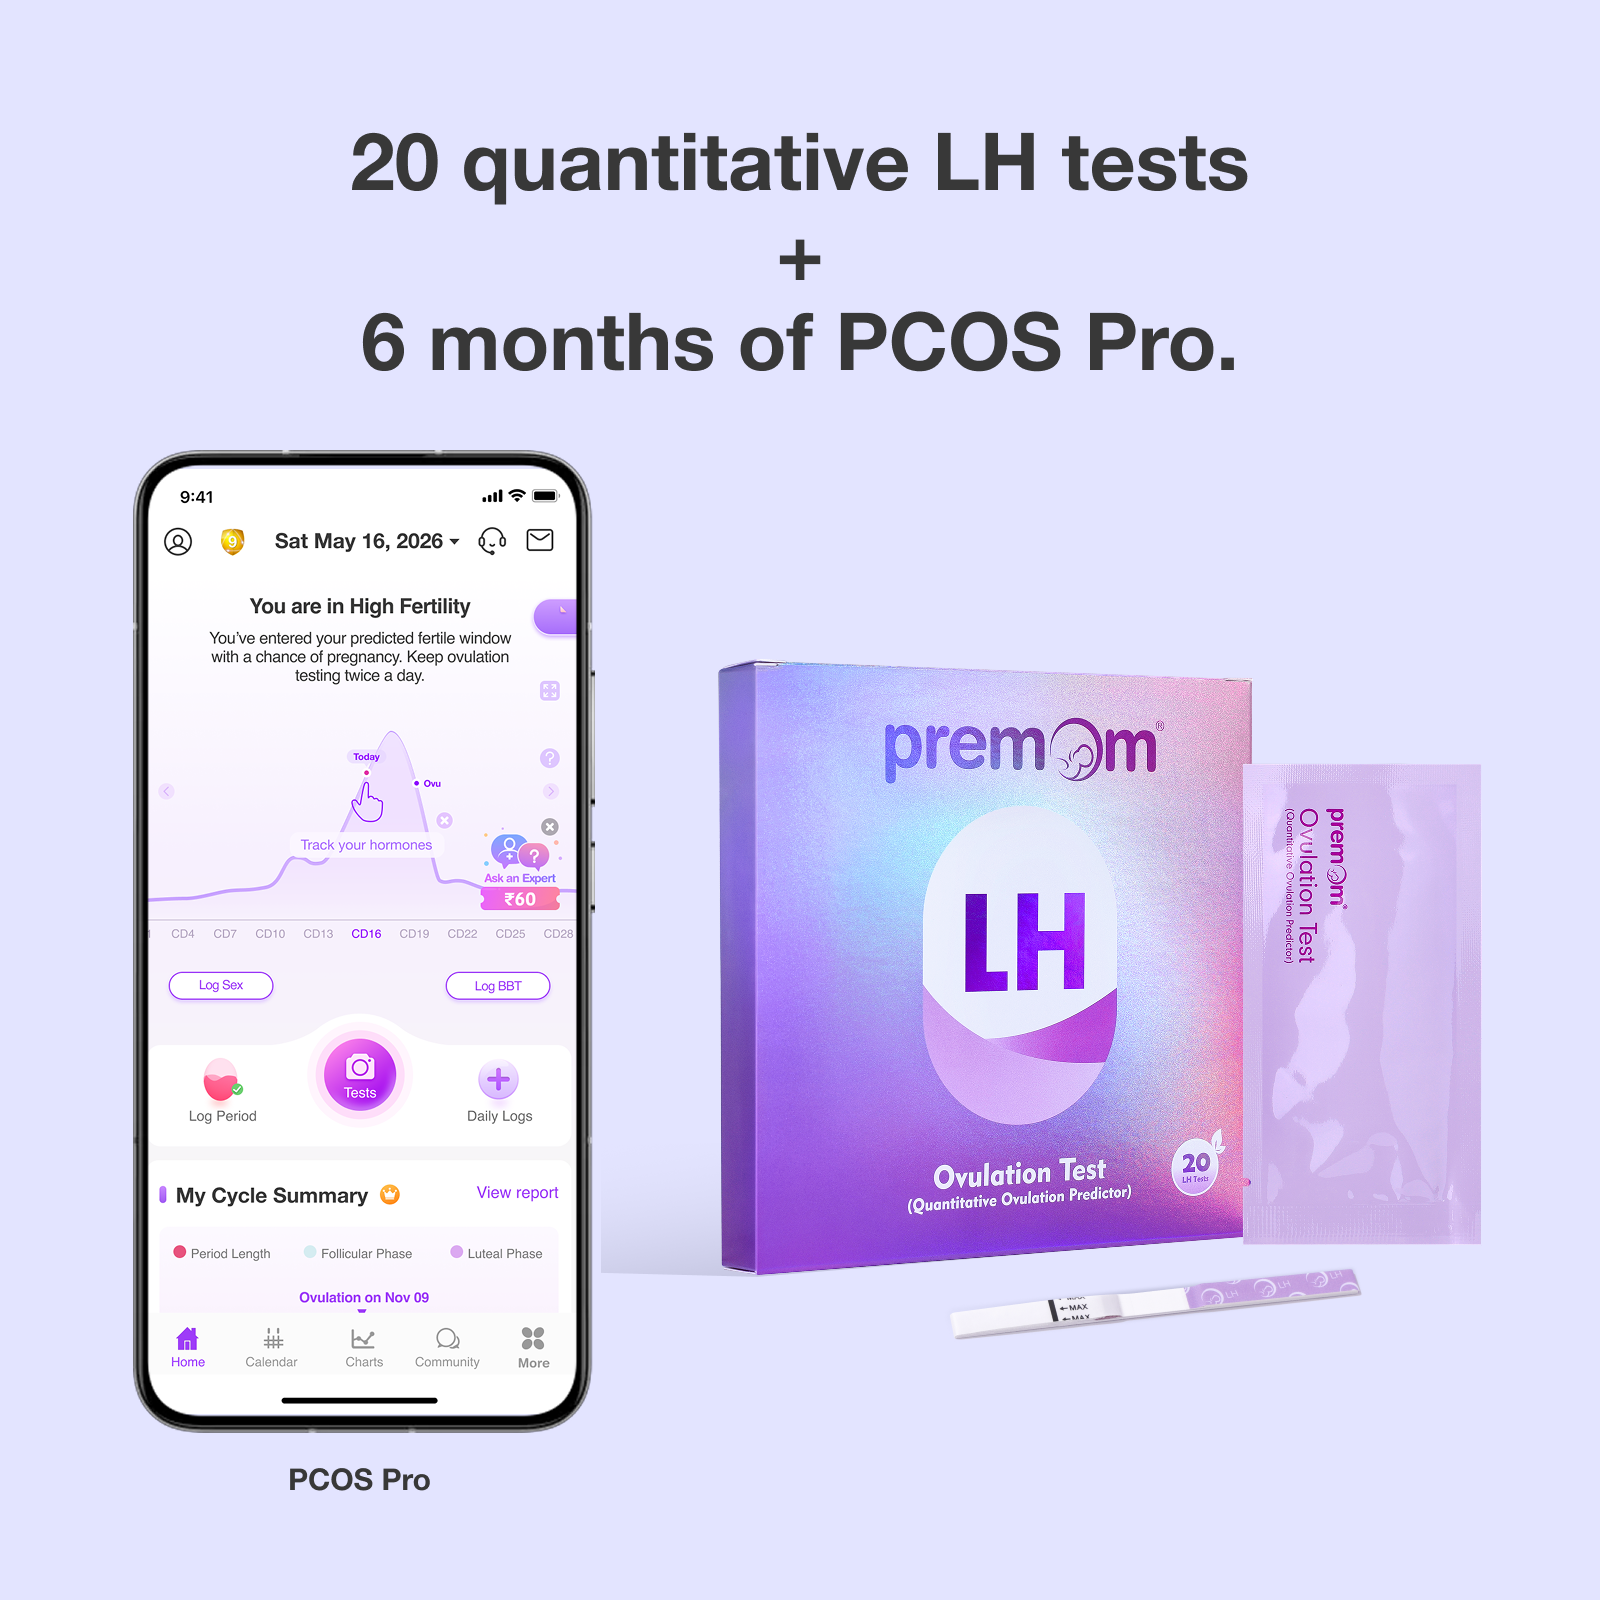
- Ovulation tests (OPKs) detect the LH surge and help predict ovulation
- BBT rise after LH peak indicates ovulation might have happened
- Using both methods may better help you identify your fertile window
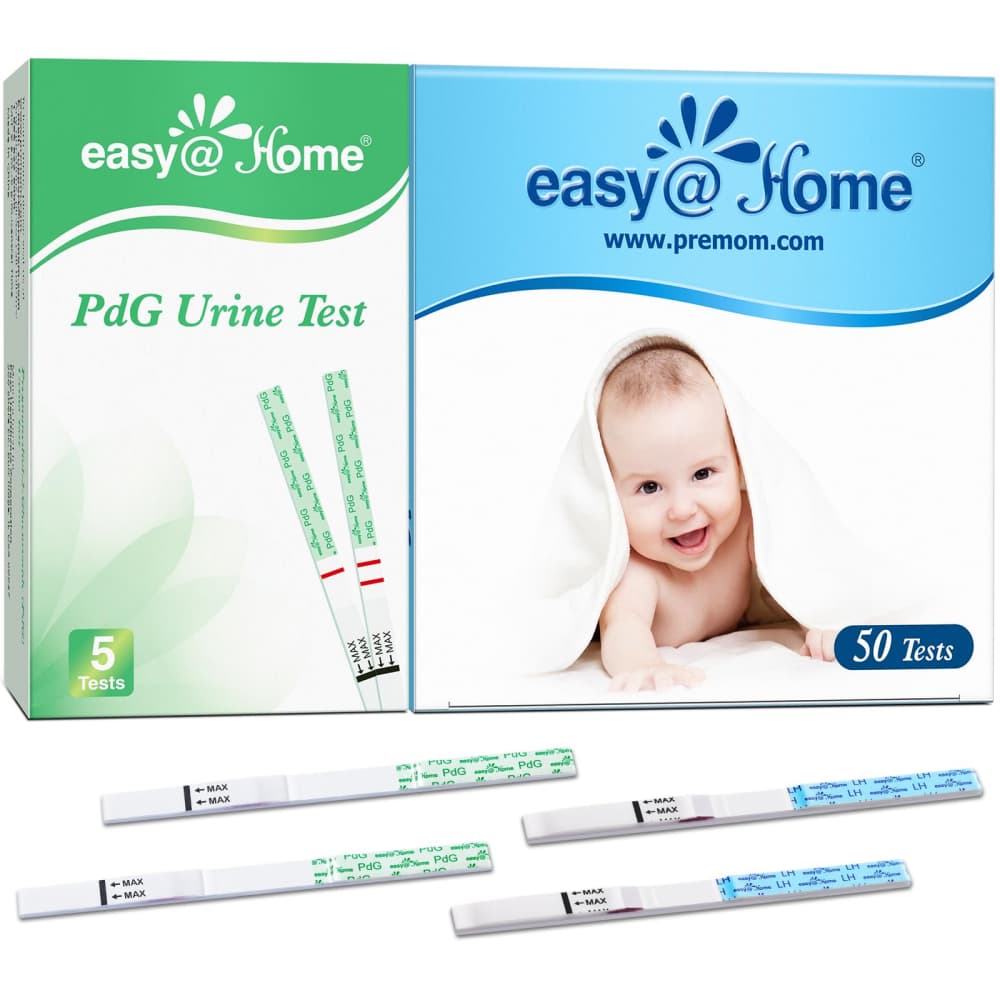
The Premom app combines BBT charts, LH tracking, and cycle analysis to give a clearer picture of your fertility. With Smart BBT tracking, you can now connect your Easy@Home or Premom Bluetooth-enabled thermometer directly to the Premom app, allowing your basal body temperature readings to be recorded automatically and precisely.
Pregnant BBT chart vs not pregnant
Progesterone naturally decreases right before your period starts if you’re not pregnant. However, it stays elevated if you are pregnant, making BBT a potential early clue to pregnancy!
So, what does a BBT pattern normally look like when not pregnant versus when you are pregnant? Let’s take a look at some Premom Pregnant BBT Charts and Not!
BBT chart not pregnant
Here is what a BBT chart looks like if you are not pregnant…
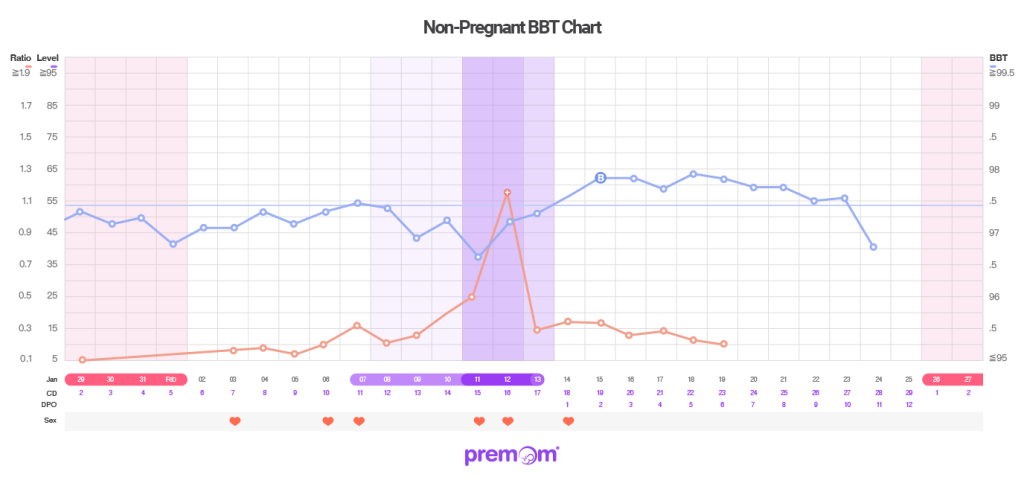
If pregnancy does not take place, your BBT chart will typically show a drop in temperature a day or two before your next menstrual period begins. This BBT drop is due to the decrease in progesterone levels in your body. Progesterone naturally decreases when you do not conceive during that menstrual cycle. If you are tracking your BBT consistently throughout your luteal phase (second half of the menstrual cycle), you may notice a dip in BBT right before the start of your next period or even the days before your period begins.
Pregnant BBT chart
Here is what a BBT chart when pregnant would look like…
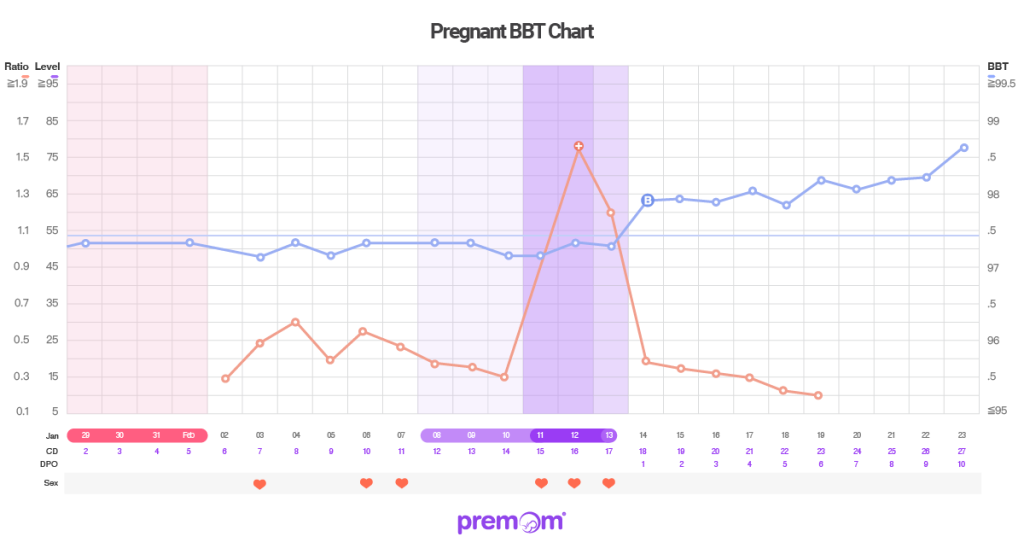
A pregnant BBT chart will typically show a sustained rise in temperature due to the increased production of progesterone in your body, which helps support the pregnancy. Typically in early pregnancy, progesterone should not be dropping; therefore, your temperatures typically do not drop either. This sustained increase in temperature on the BBT chart can be a strong indicator of pregnancy, particularly if it persists for at least 15 days after ovulation. However, it’s important to note that not all women will experience a sustained temperature rise, and some may have other symptoms or signs of pregnancy.
BBT charts can vary from person to person. There is no single basal temperature chart if pregnant or not pregnant that applies to everyone. However, these are some general trends that can be observed in BBT charts for pregnancy and non-pregnancy. A sustained increase in temperature for more than two weeks after ovulation is a common indication of a pregnancy in a BBT chart.
How does a BBT chart show pregnant vs not pregnant?
- Pregnant: Temperature remains elevated beyond 15–16 days past ovulation
- Not pregnant: Temperature drops before your period arrives, usually signaling that progesterone levels have declined
That sustained rise is driven by progesterone staying high to support a potential pregnancy. If your chart looks promising, a pregnancy test is the next step.
| Pattern | Pregnant BBT Chart | Not Pregnant BBT Chart |
|---|---|---|
| Temperature after ovulation | stays elevated | drops before period |
| Progesterone | remains high | drops |
| Implantation dip | sometimes visible | usually absent |
| Luteal phase | extended | normal length |
How long does BBT stay elevated if pregnant?
During pregnancy, you won’t see a drop in BBT like you typically would right before the start of your period. Progesterone remains high throughout the pregnancy, meaning your temperature will typically stay high throughout the entire pregnancy as well. An elevated BBT result is not a definitive sign of pregnancy. If you suspect you might be pregnant, it’s best to take a pregnancy test or call your healthcare provider.
When should you take a pregnancy test based on BBT?
You may consider testing if:
- Your BBT remains elevated for 15 days or more after ovulation
- You have a missed period
Sustained high temperatures may be an early sign of pregnancy.
Does BBT drop after implantation?
BBT does not drop after implantation; however, some women might see a slight dip in BBT during the luteal phase, usually just about 24 hours. This is due to a second surge of estrogen that happens in the luteal phase, and when estrogen rises, that causes BBT to drop slightly. Your temperature should rise again the next day, and this quick dip is nothing to worry about.
Illness, stress, alcohol, travel, and sleep changes can affect your BBT. Instead of focusing on one reading, look at the overall trend throughout your cycle. Daily fluctuations are normal.
You can easily keep track of your BBT readings in the free Premom app. You’ll be able to see your BBT readings in correlation with your LH surge to see if and when you ovulated. This also allows you to easily see what happens to your BBT right before the predicted start of a new cycle, which could be an early indicator of pregnancy.
What can affect your BBT readings?
A lot of things can shift your temperature on any given morning. None of these mean your cycle is off, they just mean that one reading isn’t the whole story.
Your BBT chart may be influenced by:
- Poor sleep or waking at different times
- Illness or fever
- Alcohol consumption
- Stress or travel
For reliable BBT tracking, focus on the pattern across days rather than any single reading.
For a deeper look at what your BBT readings mean and how to interpret them, see our full guide on understanding basal body temperature.

Pregnant vs Non-Pregnant BBT Chart Frequently Asked Questions (FAQs)
Basal body temperature (BBT) is your body’s lowest resting temperature, measured right after waking up. It changes due to hormonal shifts, especially progesterone, after ovulation. Tracking BBT helps you understand more about your ovulation patterns and your fertility cycle.
A BBT chart shows pregnancy when temperatures remain elevated for more than 15–16 days after ovulation. In a non-pregnant cycle, temperatures usually drop before your period. This pattern is influenced by progesterone levels.
You can consider taking a pregnancy test if your BBT remains high for 15–16 days after ovulation or if you miss your period. Sustained high temperatures may be an early sign of pregnancy.
BBT cannot confirm pregnancy on its own. While a sustained temperature rise may suggest pregnancy, taking a pregnancy test is a good next step, and you can book an appointment with a doctor to confirm.
A normal BBT chart shows a biphasic pattern: lower temperatures before ovulation and higher temperatures after ovulation. This shift reflects hormonal changes in the menstrual cycle.
Several factors can affect BBT readings, including poor sleep, illness, stress, alcohol, travel, and inconsistent timing for measurement.
The best time to measure BBT is immediately after waking up, before getting out of bed, and after at least 3 to 4 hours of uninterrupted sleep. Taking it at the same time each day gives you more consistent readings and makes your chart easier to read.
A drop in BBT before your period happens because progesterone levels decrease when pregnancy does not occur. This signals the start of a new menstrual cycle.
References
- Physiology, Ovulation and Basal Body Temperature- NCBI bookshelf. (2022). Retrieved from https://www.ncbi.nlm.nih.gov/books/NBK556096/
- Grant, A., & Smarr, B. (n.d.). Feasibility of continuous distal body temperature for passive, early pregnancy detection. PLOS Digital Health. Retrieved from https://journals.plos.org/digitalhealth/article?id=10.1371%2Fjournal.pdig.0000034
- Basal body temperature: Family planning method. Cleveland Clinic. (n.d.). Retrieved from https://my.clevelandclinic.org/health/treatments/21065-basal-body-temperature