
If you’re analyzing every temperature shift during the two-week wait, that sudden drop in your chart might be a basal body temperature implantation dip. This one-day temperature decrease happens around 7-8 days past ovulation, exactly when a fertilized egg would attach to your uterine wall.
Here’s what a basal body temperature (BBT) implantation dip actually looks like: Your BBT drops about 0.3°F (from 97.9°F to 97.6°F, for example) for just 24 hours before bouncing back up. While we know you’re hoping this is your sign, let’s look at what the data tells us about implantation dip BBT patterns (spoiler: it’s encouraging but not definitive).
In this guide, we’ll walk through real chart examples, show you exactly what to look for, and help you understand whether that dip you’re seeing might mean what you hope it means. We’ll also share what other Premom users have experienced and give you practical next steps for wherever you are in your tracking journey.
Why Your BBT Matters When TTC
If you’ve been tracking for a few months, you already know that BBT gives you concrete data about what’s happening with your hormones. Unlike symptom-spotting (we’ve all been there), temperature tracking provides actual numbers you can analyze.
How BBT Helps Identify Ovulation and Implantation
Your BBT creates a month-by-month story of your fertility. Before ovulation, you’ll typically see temps between 97-98°F. After ovulation, thanks to progesterone, they usually rise by about 0.5–1.5°F from your pre-ovulatory baseline. This shift, what we call a biphasic pattern, helps identify if ovulation happened.
The beauty of BBT tracking? It costs nothing, has zero side effects, and gives you real data instead of guesswork. Plus, when you’re in the two week wait, analyzing every twinge and DPO symptom, having actual temperature data helps ground you in facts.
BBT During Implantation: What to Expect
Here’s where things get interesting for those of you currently in the TWW:
If you’re not pregnant this cycle, your temps will stay elevated for about 14 days, then drop as your period arrives. But if you conceived? Your body keeps pumping out progesterone, keeping those temps high past when your period should start.
The magic number to remember: if your temps stay up for 18 days or more, it’s probably time to grab a test. Since the luteal phase (the “high-temp” part of your cycle) usually lasts no more than 17 days, seeing temps stay elevated past that is a good sign your body’s likely making pregnancy-level progesterone.
What Is a Basal Body Temperature Implantation Dip?
Let’s talk about that dip you might be seeing (or hoping to see) on your chart.
What Does a BBT Implantation Dip Look Like on Charts?
An implantation dip isn’t dramatic; we’re talking about a drop of roughly 0.3°F for just one day. Picture this example on your BBT chart:
Day 6 DPO: 97.8°F
Day 7 DPO: 97.5°F (the dip!)
Day 8 DPO: 97.9°F (back up)
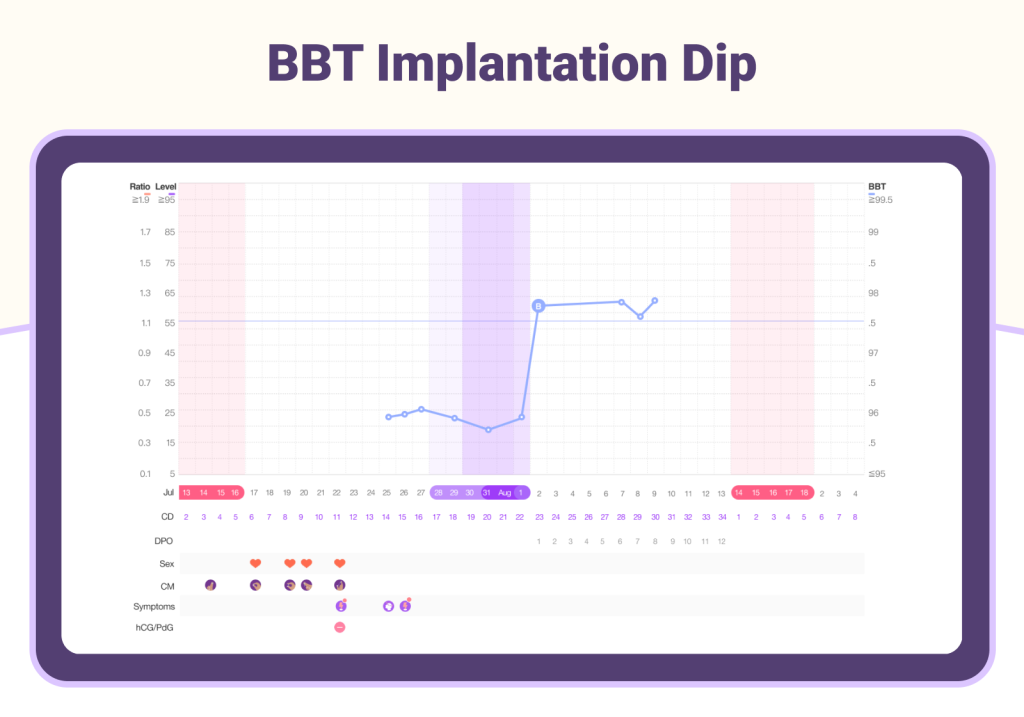
It creates a little V-shape in your otherwise steady luteal phase temps. Quick, subtle, but definitely noticeable when you’re checking your chart every morning.
When Does Implantation Dip Occur?
Most implantation dips happen between 6-12 days past ovulation, with days 7-8 being the sweet spot. This timing makes sense because actual implantation typically occurs somewhere between 6-10 days after ovulation.
A large-scale analysis conducted by Fertility Friend from over 1.5 million user charts found the average dip occurred at 8.6 DPO, right in that implantation window.
How Many Degrees Is an Implantation Dip?
A true basal body temperature implantation dip typically measures about 0.3°F (0.17°C). This isn’t a dramatic plunge; if your normal luteal phase temp is 97.9°F, you might see 97.6°F for that single day before bouncing back.
Can an Implantation Dip Predict Pregnancy?
We know you want this basal body temperature implantation dip to mean pregnancy, so let’s look at what the data actually tells us.
Implantation Dip vs Other Luteal Phase Dips
Not every temperature drop is an implantation dip. That mid-luteal dip you’re seeing could be from a secondary estrogen surge that happens 5-7 days after ovulation in many cycles — pregnant or not. The key difference? An implantation dip on your BBT chart is isolated: one day down, immediately back up.
Is BBT Implantation Dip a Reliable Pregnancy Sign?
According to the same large-scale chart analysis, here’s what the data shows:
- BBT charts with an implantation dip are 79.8% more likely to be pregnancy charts than non-pregnancy charts
- The dip appears in 23% of pregnancy charts versus 11% of non-pregnancy charts
- BUT (and this is important) — 75% of pregnant women never see a BBT implantation dip at all
If you see an implantation dip on your BBT chart, that’s encouraging! If you don’t, you’re in good company with most pregnant women. Remember, this data comes from user-submitted charts rather than clinical studies, but it represents the largest dataset available on this pattern.
Other Early Pregnancy Signs to Watch
Since most pregnant women don’t get an implantation dip, here’s what else might signal success:
- Sustained high BBT for 18+ days (strongest indicator)
- Triphasic pattern on pregnancy BBT chart (third temperature rise)
- Light implantation bleeding (25% of pregnancies)
- Breast changes earlier than usual PMS
- Unusual fatigue around 8-10 DPO
How to Read BBT Implantation Dip Charts
Let’s get into the nitty-gritty of what you’re actually looking for on your pregnancy BBT chart.
Identifying a True Basal Body Temperature Implantation Dip
Here’s your checklist for spotting a potential implantation dip on your BBT chart:
✓ Occurs 6-12 DPO (ideally 7-8 DPO)
✓ Lasts just one day
✓ Drops about 0.3°F (not a huge plunge)
✓ Temperature bounces right back up the next day
✓ Stays above your coverline (usually)
What a Pregnancy BBT Chart Looks Like With Implantation Dip
Here’s a real example from a Premom user who got her BFP with a BBT implantation dip:
“My temps were steady at 97.9°F from 3-6 DPO. On 7 DPO, I saw an implantation dip to 97.6°F. I tried not to get excited, but the next day it shot up to 98.1°F and stayed high. Got my positive test at 11 DPO!”
BBT Chart Patterns That Aren’t Implantation Dips
Not every dip is an implantation dip. You might also see:
- Random luteal phase dips from estrogen surges (totally normal)
- Slow rise patterns where temps gradually increase
- Rocky temps from poor sleep, alcohol, or stress
The key difference? A true BBT implantation dip is isolated, one day down, right back up.
Making Tracking Easier with Premom
If you’re still manually logging temps and worried about missing your ovulation window, Premom’s Smart BBT tools help to eliminate the guesswork:
Premom’s FastPass™ to Pregnancy: With consistent ovulation testing and BBT tracking, you have a fully guided and optimized approach to timing conception. Women who followed the Premom FastPass method achieved a pregnancy rate 202% higher than those who didn’t. Consistency is everything when you’re looking for subtle patterns like implantation dips.
Hands-Free Wired BBT: Imagine never fumbling for a thermometer at 5 AM again. Simply place the Premom Hands-Free Wired BBT on your pillow, pop the probe in your mouth, and drift back to sleep. Your temperature automatically syncs to the Premom app, no buttons, no squinting at displays, no forgotten entries.
BBT Auto-Scan: Don’t have a Bluetooth thermometer? No problem. Premom’s Auto-Scan feature works with any digital BBT thermometer. Just hover your phone’s camera over your thermometer display, and within seconds, your temp is logged and charted. This means:
- No more manual handwritten errors that could hide an implantation dip
- No forgotten temps on busy mornings with Premom App Reminders
- Clean, accurate data showing your BBT patterns
- Works with the thermometer you already own
Whether you’re hoping to spot a basal body temperature implantation dip or simply want reliable fertility data, these tools help make tracking your fertility easier.
The Bottom Line
We get it, the TWW is tough, and you’re looking for any sign that this is your month. An implantation dip can be an encouraging sign, but it’s not required for pregnancy. Many women posting their BFPs in forums never saw one.
What matters most:
- Consistent tracking to see your cycle patterns
- Sustained high temps beyond 14 DPO
- Testing at the right time (not at 7 DPO, no matter how tempting!)
Whether you see a dip or not, you’re doing everything right by tracking and understanding your body. Trust your chart, trust the process, and remember, every pregnancy chart looks different.
Key Takeaways
- Implantation dips are encouraging but not essential — appearing in only 23% of pregnancy charts
- Timing matters — Look for a 0.3°F drop around 7-8 DPO that lasts just one day
- Charts with dips are 79.8% more likely to be pregnancy charts — but 75% of pregnant women never see one
- Sustained high temps beat single dips — 18+ days of elevated BBT is a stronger pregnancy sign
- Accurate tracking is crucial — Tools like Premom’s Smart BBT eliminate human error so you can spot real patterns
- Test smart, not early — Wait until 12-14 DPO for reliable results, even if you see a perfect dip
The most important thing? You’re already doing amazing by tracking and learning your body’s unique patterns. Whether this is your cycle or not, every chart teaches you something valuable about your fertility.
BBT Implantation Dip – FAQs
While possible, it’s early. Implantation typically occurs 8-10 DPO. A dip at 6 DPO is more likely from normal hormone fluctuations, but keep tracking — your pattern over the next few days will tell you more.
A deeper dip doesn’t necessarily mean more or less chance of pregnancy. What matters is that your temp bounces back up the next day. Some women see dramatic dips and get BFPs, others see tiny dips, and many see no dip at all.
A true implantation dip typically lasts just one day — that’s what makes it distinctive. If you’re seeing a 2-day dip, it’s likely from other factors like an estrogen surge or sleep disruption, but it doesn’t mean you couldn’t be pregnant. Keep tracking and focus on whether temps stay high past 14 DPO.
We know it’s tempting, but wait! Even with a perfect implantation dip at 7-8 DPO, your body needs several more days to produce enough hCG for a positive test. Testing at 12-14 DPO gives you the most reliable result.
Absolutely not! Remember, 75% of pregnant women don’t see implantation dips. Some women get pregnant cycle after cycle without ever seeing this pattern. Focus on overall temperature patterns rather than waiting for one specific sign.
Stress typically causes erratic temps throughout your cycle rather than a single, isolated dip. However, poor sleep, alcohol, or illness can cause temporary drops. That’s why consistent tracking conditions (same time, same thermometer, before getting up) matter so much.
References
Fertility Friend. Implantation Dip Study. FertilityFriend.com Statistical Analysis. Available at: https://www.fertilityfriend.com/Faqs/Implantation-dip-study.html
Cole LA. The hCG assay or pregnancy test. Clin Chem Lab Med. 2012;50(4):617-630. doi:10.1515/cclm.2011.808
UPMC. Bleeding During Pregnancy Causes, Symptoms, and Treatments. UPMC. Last reviewed September 5, 2024. Accessed October 21, 2025. https://www.upmc.com/services/womens-health/conditions/pregnancy-bleeding.
