Trying to conceive can already feel overwhelming—and when your basal body temperature (BBT) chart looks like a rollercoaster, it’s easy to worry. If your BBT chart is looking inconsistent, you may be questioning: Does this mean I didn’t ovulate? Am I doing something wrong?
The truth is, a messy or irregular BBT chart doesn’t always mean something is wrong with your body. More often, it’s about small factors that throw off your readings. Let’s walk through what a “typical” chart should look like, why yours may look irregular, and what you can do to make sense of it.
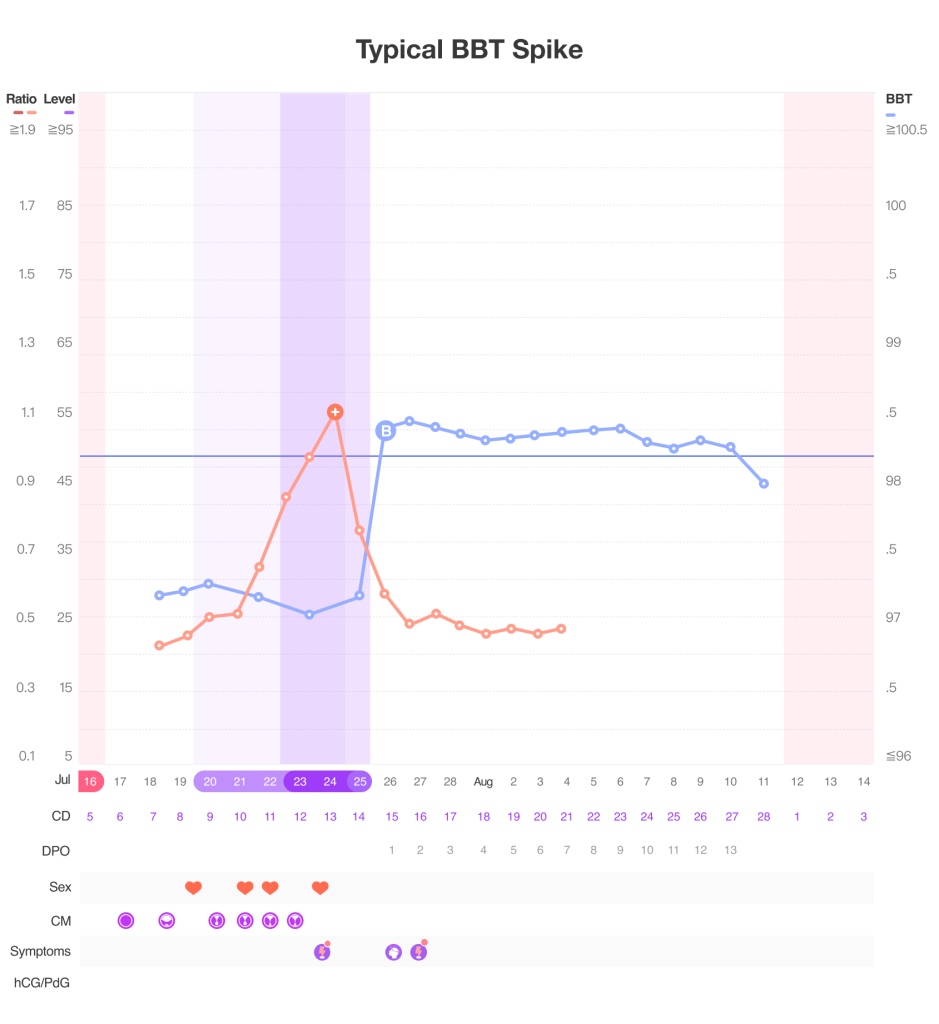
What a Typical BBT Spike Should Look Like
In a textbook fertility chart, your BBT stays lower during the follicular phase (the first half of your cycle). Once ovulation happens, progesterone rises, causing your temperature to jump about 0.5–1°F. This shift is called the ovulatory rise.
From there, your temps stay elevated through the luteal phase (the two weeks after ovulation). If pregnancy doesn’t occur, progesterone drops—and so does your BBT—just before your period.
The Most Common Reasons BBT Looks Messy
Sometimes your chart looks like zigzags instead of a steady rise and plateau. Here are the most common causes:
Measuring at inconsistent times
BBT is sensitive. If you take your temperature at 6:00 a.m. one day and 9:30 a.m. the next, you might see fluctuations that aren’t hormonal. Even snoozing your alarm and temping later than usual may cause irregular readings.
Short or disrupted sleep
Your body needs at least 3–4 hours of solid, consistent sleep for accurate BBT readings. Night wakings, insomnia, travel, or time zone shifts can all cause erratic temps.
Alcohol, illness, or certain medications
Alcohol can raise body temperature, just like an illness (with a fever) can also naturally increase it. Medications such as thyroid hormone or fertility drugs may also influence your readings. If you make any changes to your typical routine, take note of it and see how that affects your readings.
Room temperature changes
A hot night with heavy blankets, or sleeping in a cold room, may slightly nudge your BBT up and down. This shouldn’t cause crazy changes in your temperature readings; however still something important to note in case you notice any outliers.
Stress & lifestyle factors
High stress, big schedule changes, or intense workouts can sometimes cause small temperature fluctuations that make your chart look messy. These shifts are normal and usually nothing to worry about. Logging lifestyle changes on your chart or in an app like Premom can make it easier to spot patterns.
Hormonal factors: PCOS, thyroid, postpartum, perimenstrual inflammation
Conditions like polycystic ovary syndrome (PCOS) or thyroid issues can make ovulation less predictable, which can show up as messy BBT patterns. Inflammation, postpartum hormone shifts, or perimenopause can also cause irregularities.
What if your chart never shows a clear rise?
Sometimes, an irregular BBT chart may reflect a cycle where ovulation didn’t occur (anovulatory cycle). This can happen occasionally in healthy women. If you are tracking ovulation using multiple methods and are still unsure, it may help to dig deeper – PdG tests can give you more insight into whether your body is showing signs of ovulation. You can also check in with your provider to discuss additional testing options.
How to Fix a Messy BBT Chart
Here are a few ways to troubleshoot and get clearer insights from your basal body temperature chart:
1. Standardize your temping routine
Take your BBT at the same time each morning, ideally before getting out of bed or moving around. Consistency helps reveal the subtle temperature shifts that indicate ovulation.
2. Ensure adequate, uninterrupted sleep
Aim for at least 3–4 hours of continuous sleep before taking your temperature. Interrupted or insufficient sleep can cause spikes or drops that make your chart harder to read.
3. Use the same thermometer consistently
Stick with the same thermometer and oral measurement method throughout your cycle. Switching devices or techniques can cause small variations that make your chart harder to interpret.
4. Record additional context
Note factors like illness, alcohol, stress, or disrupted sleep in your chart. These can affect BBT readings, and tracking them helps you spot true ovulation patterns.
5. Use Premom to track smarter
Sync your readings with a smart BBT thermometer in the Premom app to automatically log temps, visualize patterns, and reduce manual errors. This makes spotting your ovulation shift much easier, even if a few outliers appear.
How to mark and discard outlier temps
We all have days where life gets in the way of perfect BBT tracking—maybe you were sick, had a restless night, or enjoyed a drink. Mark these readings as “outliers” in your chart so you don’t let them confuse your pattern. Focus on your overall temperature trend rather than stressing over one or two unusual temps, and remember that spotting your BBT spike is about the bigger picture, not a single reading.
Pairing BBT with ovulation tests for clearer predictions
A rise in basal body temperature signals that ovulation has likely occurred. But if your goal is to get pregnant, timing sex before ovulation is key—so tracking only BBT isn’t enough.
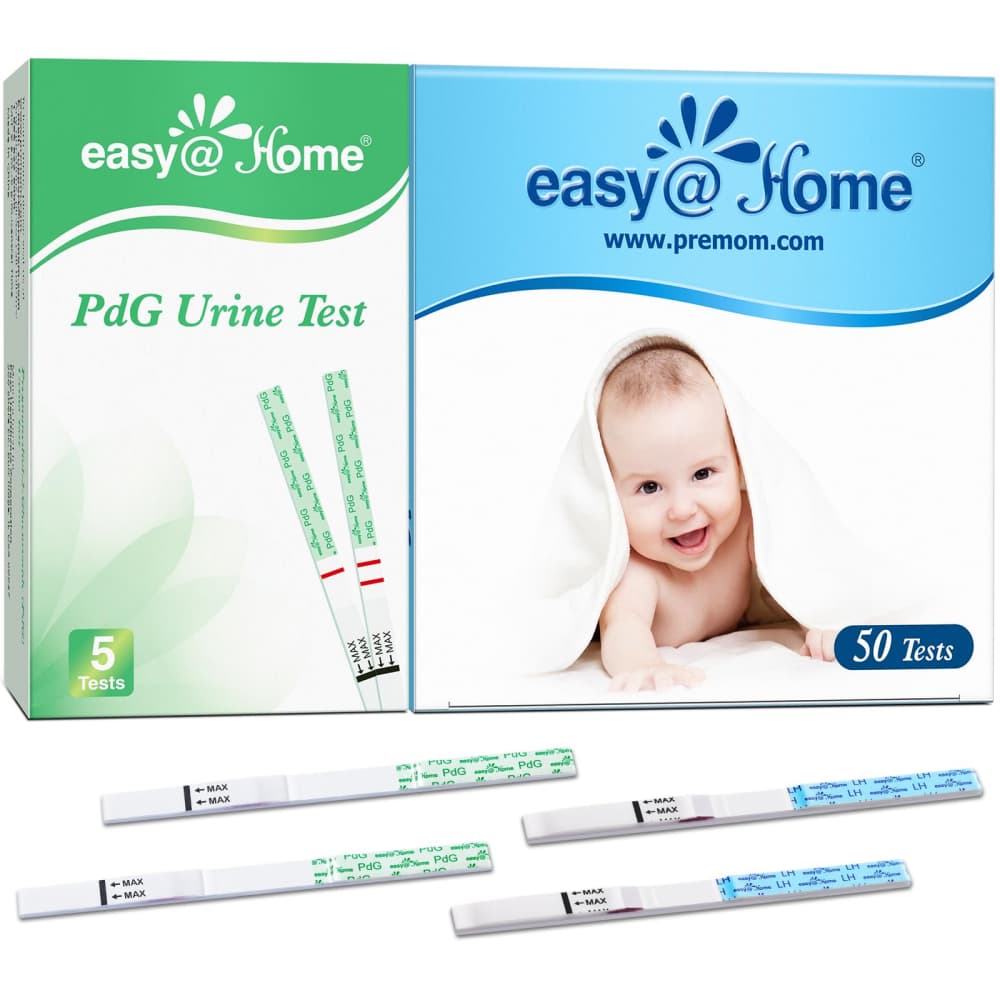
That’s where ovulation predictor kits (OPKs) and PdG strips can help:
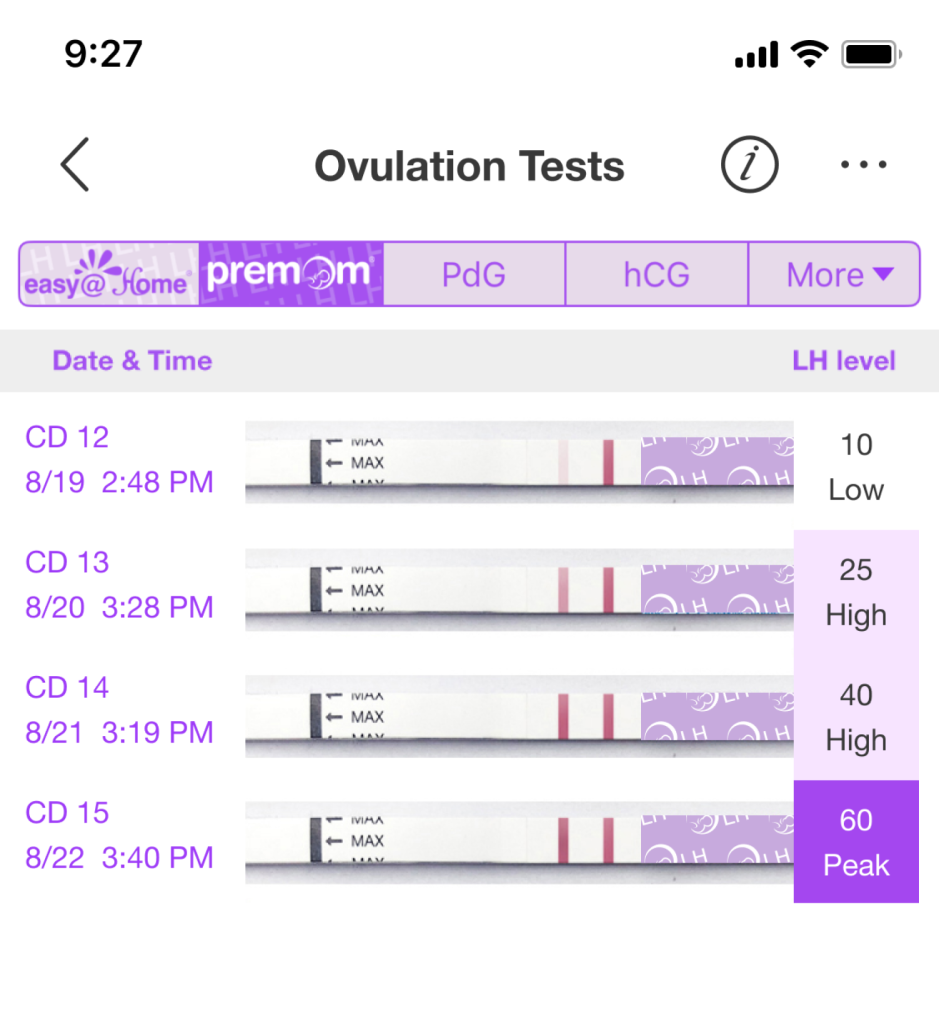
- OPKs detect your LH surge, usually 12–36 hours before ovulation, giving you a heads-up to time sex.
- PdG strips measure a progesterone metabolite in urine after ovulation, indicating that ovulation likely took place.
Using BBT, OPKs, and PdG strips together gives a more complete picture of your cycle—before, during, and after ovulation—so you can better understand your fertile window. With Premom, you can log all three in one place, visualize patterns, and track your cycle with ease.
Reading Patterns in “Noisy” BBT Charts
Sometimes your chart won’t look like those perfectly smooth examples online — and that’s okay! Even when your temperatures seem a little “all over the place,” there are still patterns you can spot:
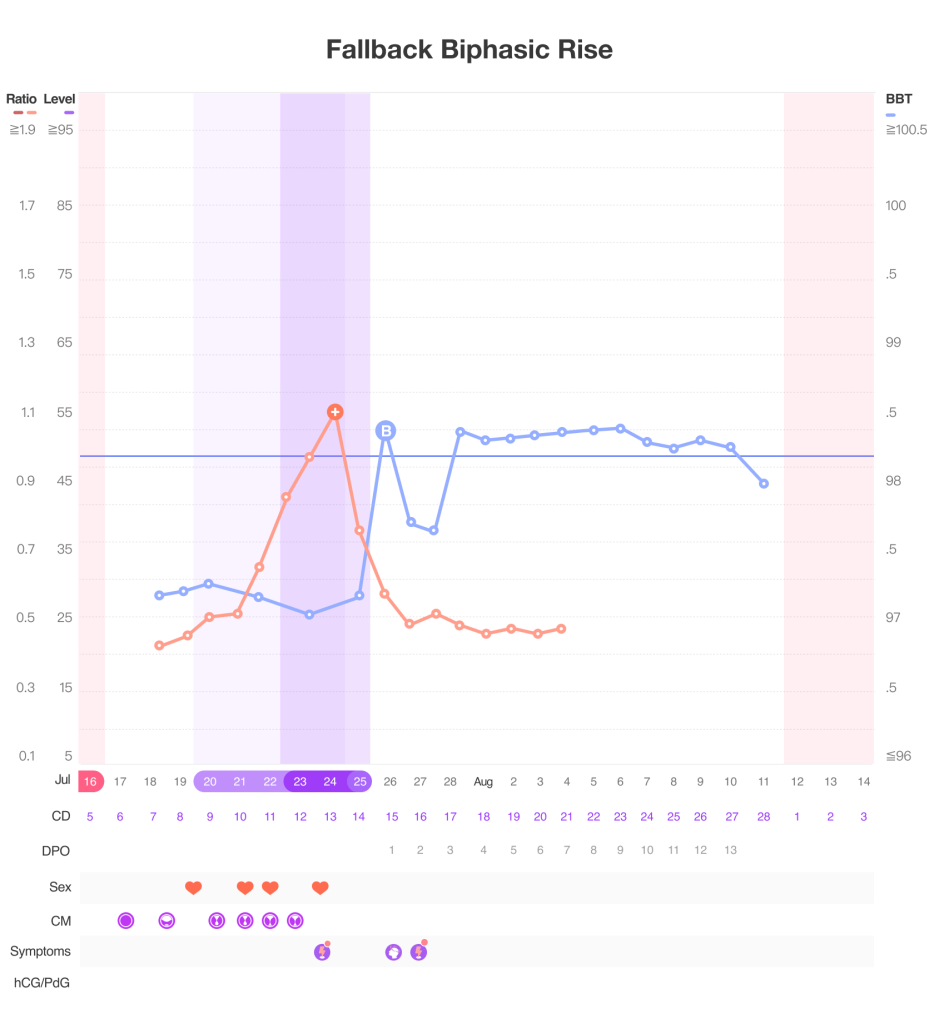
- Fallback Biphasic Rise: You might see your temperature spike, dip for a day, and then rise again. This can still be completely normal and doesn’t mean you didn’t ovulate.
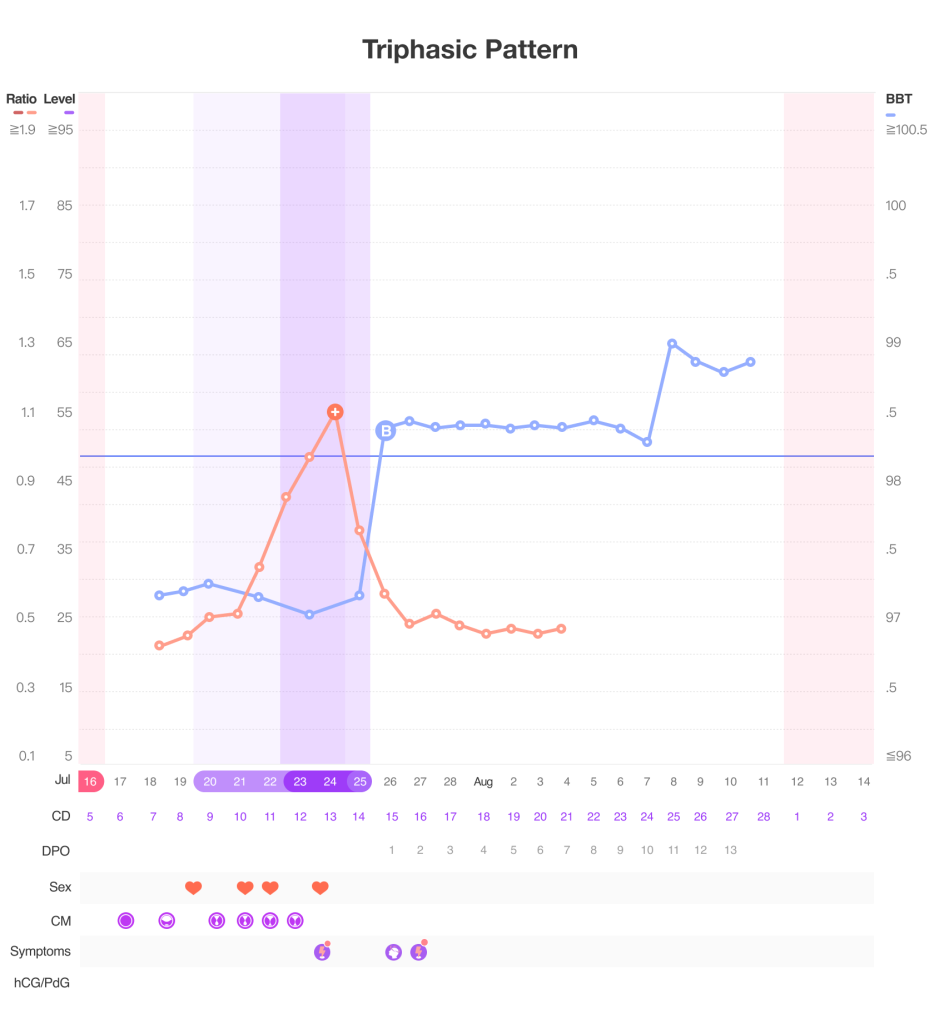
- Triphasic Patterns: Some women notice a second temperature rise later in the luteal phase. While it can sometimes be linked to early pregnancy, it can also happen in non-pregnant cycles — so it’s just one clue, not a guarantee.
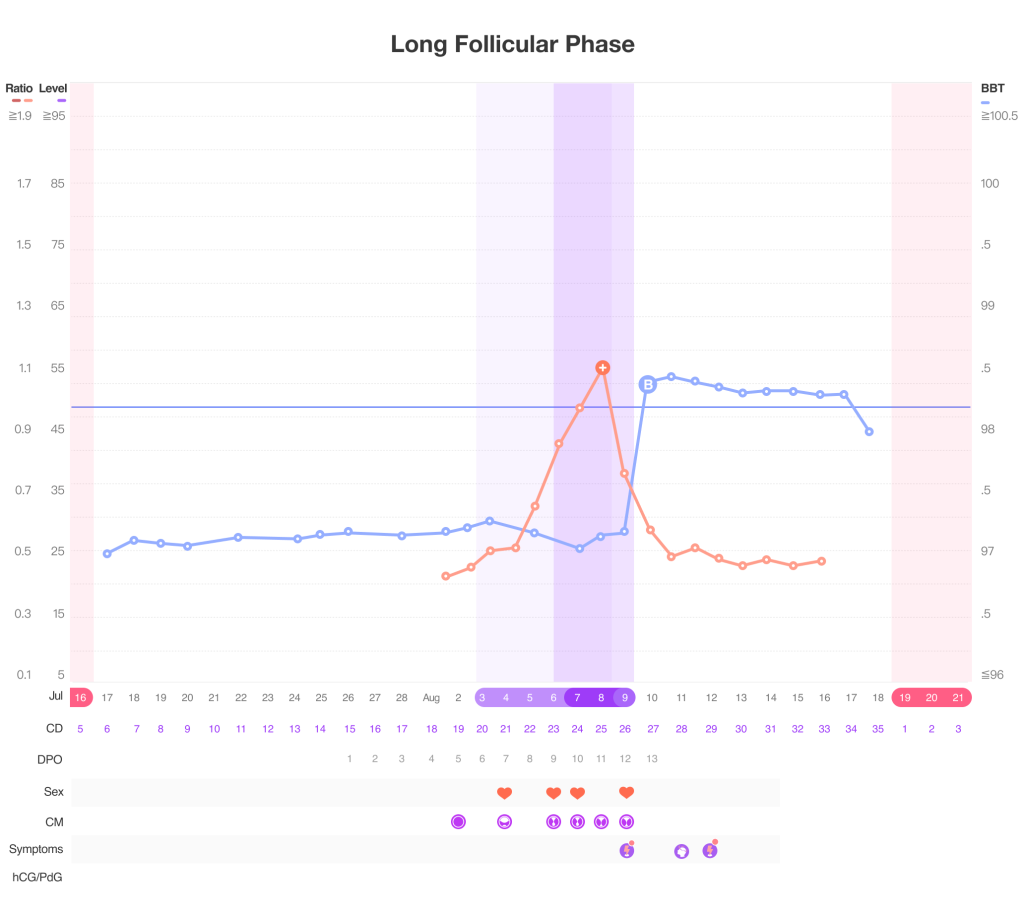
- Long Follicular Phases: If your temps stay low longer before finally rising, it may simply mean your body took a little extra time to ovulate that cycle.
Messy charts can still tell you a lot once you know what to look for. If you want to see the difference between BBT charts in pregnant vs. non-pregnant cycles, this guide breaks it down clearly.
When a Messy BBT Chart Still Means Ovulation vs. When It Doesn’t
Even if your BBT chart looks jagged or inconsistent, ovulation can still happen. Look for an overall upward shift in your temps compared to your earlier cycle days—this usually signals that ovulation likely occurred.
If your temperatures stay mostly flat with no clear rise, it could be an anovulatory cycle, meaning ovulation may not have taken place that month. Remember, a few irregular readings don’t necessarily mean you didn’t ovulate—focus on the bigger picture of your cycle to see your pattern clearly.
How Premom Helps You Make Sense of Your Data
Meet FertilityPro AI – Your Personal Cycle Guide
Premom’s FertilityPro AI can help you analyze your BBT, ovulation tests, and PdG data to provide personalized insights. It can help you understand unusual temps, explain patterns, and even answer questions about your cycle based on your own data.
Auto-Sync and Stay Consistent
Using the Easy@Home Smart Basal Thermometer, your temperatures sync automatically to Premom, and reminders help you track consistently. This reduces errors and makes spotting patterns much easier.
Bonus Tip: Don’t have a Bluetooth Premom or Easy@Home thermometer? No problem! Premom’s BBT Autoscan feature lets you quickly scan temps from any standard thermometer right into the app, so you can keep tracking without missing a beat.
Track Smarter with BBT and Tests
Take your basal body temperature at the same time each morning and log it consistently. Pairing BBT with ovulation predictor kits (OPKs) and progesterone urine tests (PdG tests) gives a complete picture of your fertile window—before, during, and after ovulation. Track all three in the free Premom ovulation tracker app!
Irregular BBT Charts FAQ
Not always. BBT shows patterns, but pairing with PdG testing gives stronger evidence that ovulation likely occurred. If your chart looks inconsistent, using both methods together can help you feel more confident in your tracking.
Wearables can make tracking easier, but a dedicated basal body temperature (BBT) thermometer is often more reliable. That’s because BBT thermometers measure your internal temperature, while many wearables track wrist or skin temperature, which can be affected by your environment.
If you’re consistent and take your BBT at the same time each morning before getting out of bed, a standard BBT thermometer usually provides accurate readings for detecting ovulation. With Premom, you also have the option to sync your temperatures from a smart BBT thermometer directly into the app, making tracking and pattern recognition even easier.
It’s okay to remove obvious outliers—like after illness or poor sleep—but keep enough data to see your overall pattern. If you discard too many, it may be harder to spot your temperature shift (BBT spike) and identify when ovulation occurred.
References
Demir, A., Hero, M., Holopainen, E., & Juul, A. (2022). Quantification of urinary total luteinizing hormone immunoreactivity may improve the prediction of ovulation time. Frontiers in Endocrinology, 13, 903831. https://doi.org/10.3389/fendo.2022.903831
Ecochard, R., Leiva, R., Bouchard, T., et al. (2017). Use of urinary pregnanediol 3-glucuronide and other fertility indicators to identify the fertile window. Fertility and Sterility, 107(2), 361–368. https://doi.org/10.1016/j.fertnstert.2016.10.038
Keselman, A., Mikhail, M., & Patel, N. (2023). Quantitative measurement of urinary luteinizing hormone and its application in ovulation prediction. Frontiers in Public Health, 11, 9960263. https://doi.org/10.3389/fpubh.2023.9960263
Prior, J. C., Naess, M., Langhammer, A., & Forsmo, S. (2018). Ovulation prevalence in women with spontaneous normal-length menstrual cycles—A population-based cohort from HUNT3, Norway. PLOS ONE, 13(12), e0207457. https://doi.org/10.1371/journal.pone.0207457