What is Basal Body Temperature?
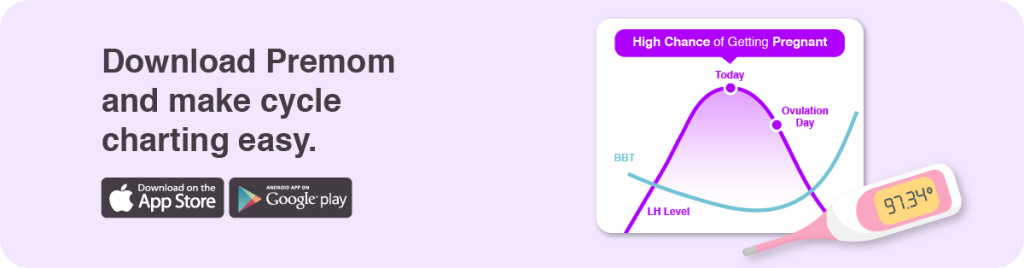
Basal body temperature (BBT) is your body’s resting temperature, measured immediately after waking and before any activity. It reflects subtle hormonal changes across the menstrual cycle.
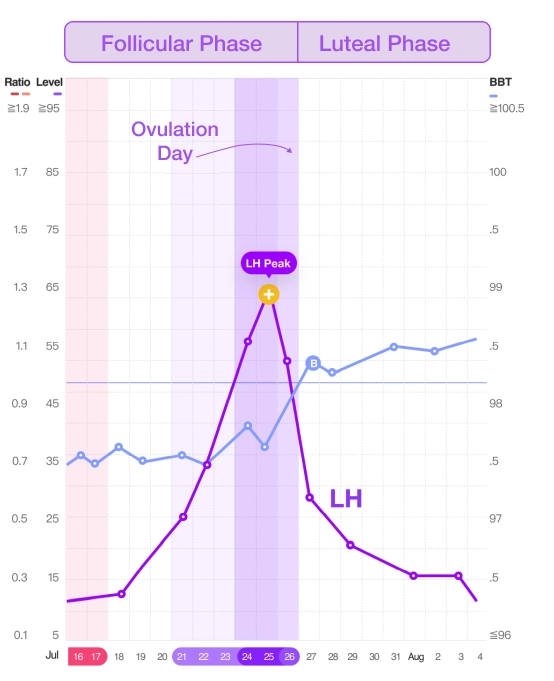
During the follicular phase—before ovulation—estrogen keeps temperatures slightly lower. After ovulation, progesterone rises and warms the body, causing a sustained increase of about 0.5–1 °F (0.3–0.6 °C). This shift typically appears one to three days after the egg is released and continues through the luteal phase until the next period or early pregnancy.
Because the change is small, consistency matters. For the most accurate chart, use a digital basal thermometer at the same time each morning after at least three hours of uninterrupted sleep. Illness, alcohol, or even getting up to use the bathroom can temporarily raise readings and mask the true pattern.
Tracking these daily temperatures reveals a clear “thermal shift,” helping you identify if there was successful ovulation and estimate the fertile window in future cycles. Traditionally, people recorded BBT by hand on paper charts, but many now log data in fertility apps or pair a smart thermometer for automatic graphing and coverline detection, making it easier to spot the pattern without the manual calculation.
What is a BBT Coverline?
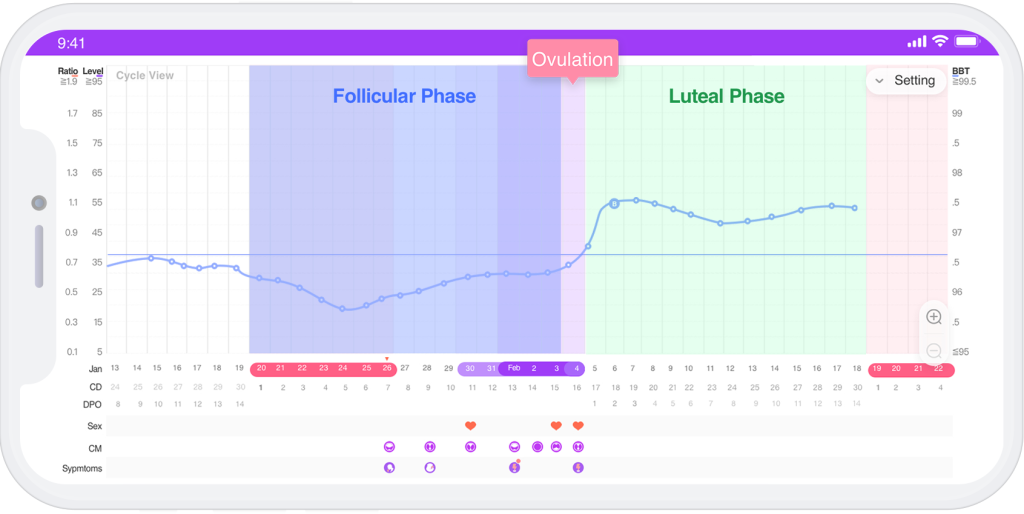
A coverline is the horizontal marker on your basal body temperature chart that makes the ovulation shift easier to see. It’s drawn just above the last low temperature before your post-ovulation rise, dividing the chart into two clear phases: the lower pre-ovulatory temperatures of the follicular phase and the higher post-ovulatory temperatures of the luteal phase. Seeing this line makes it easy to spot the sustained temperature increase that signals ovulation has likely occurred.
Thanks to the rapid development of A.I. (Artificial Intelligence), you can sync your temperature readings on the Premom Ovulation Tracker app and find the coverline on your fertility chart.
Who Should Choose BBT Tracking as an Ovulation Calculator Method?
The best-suited BBT tracking users have a routine schedule and a consistent wake-up time.
We highly recommend BBT tracking to women who have PCOS, luteinized unruptured follicle (LUF), a rapid LH surge, or low LH levels because it’s not always evident if ovulation likely occurred based on ovulation testing alone.
What Are the Challenges and Solutions of Basal Body Temperature Tracking?

How to Chart Your BBT with the Premom App?
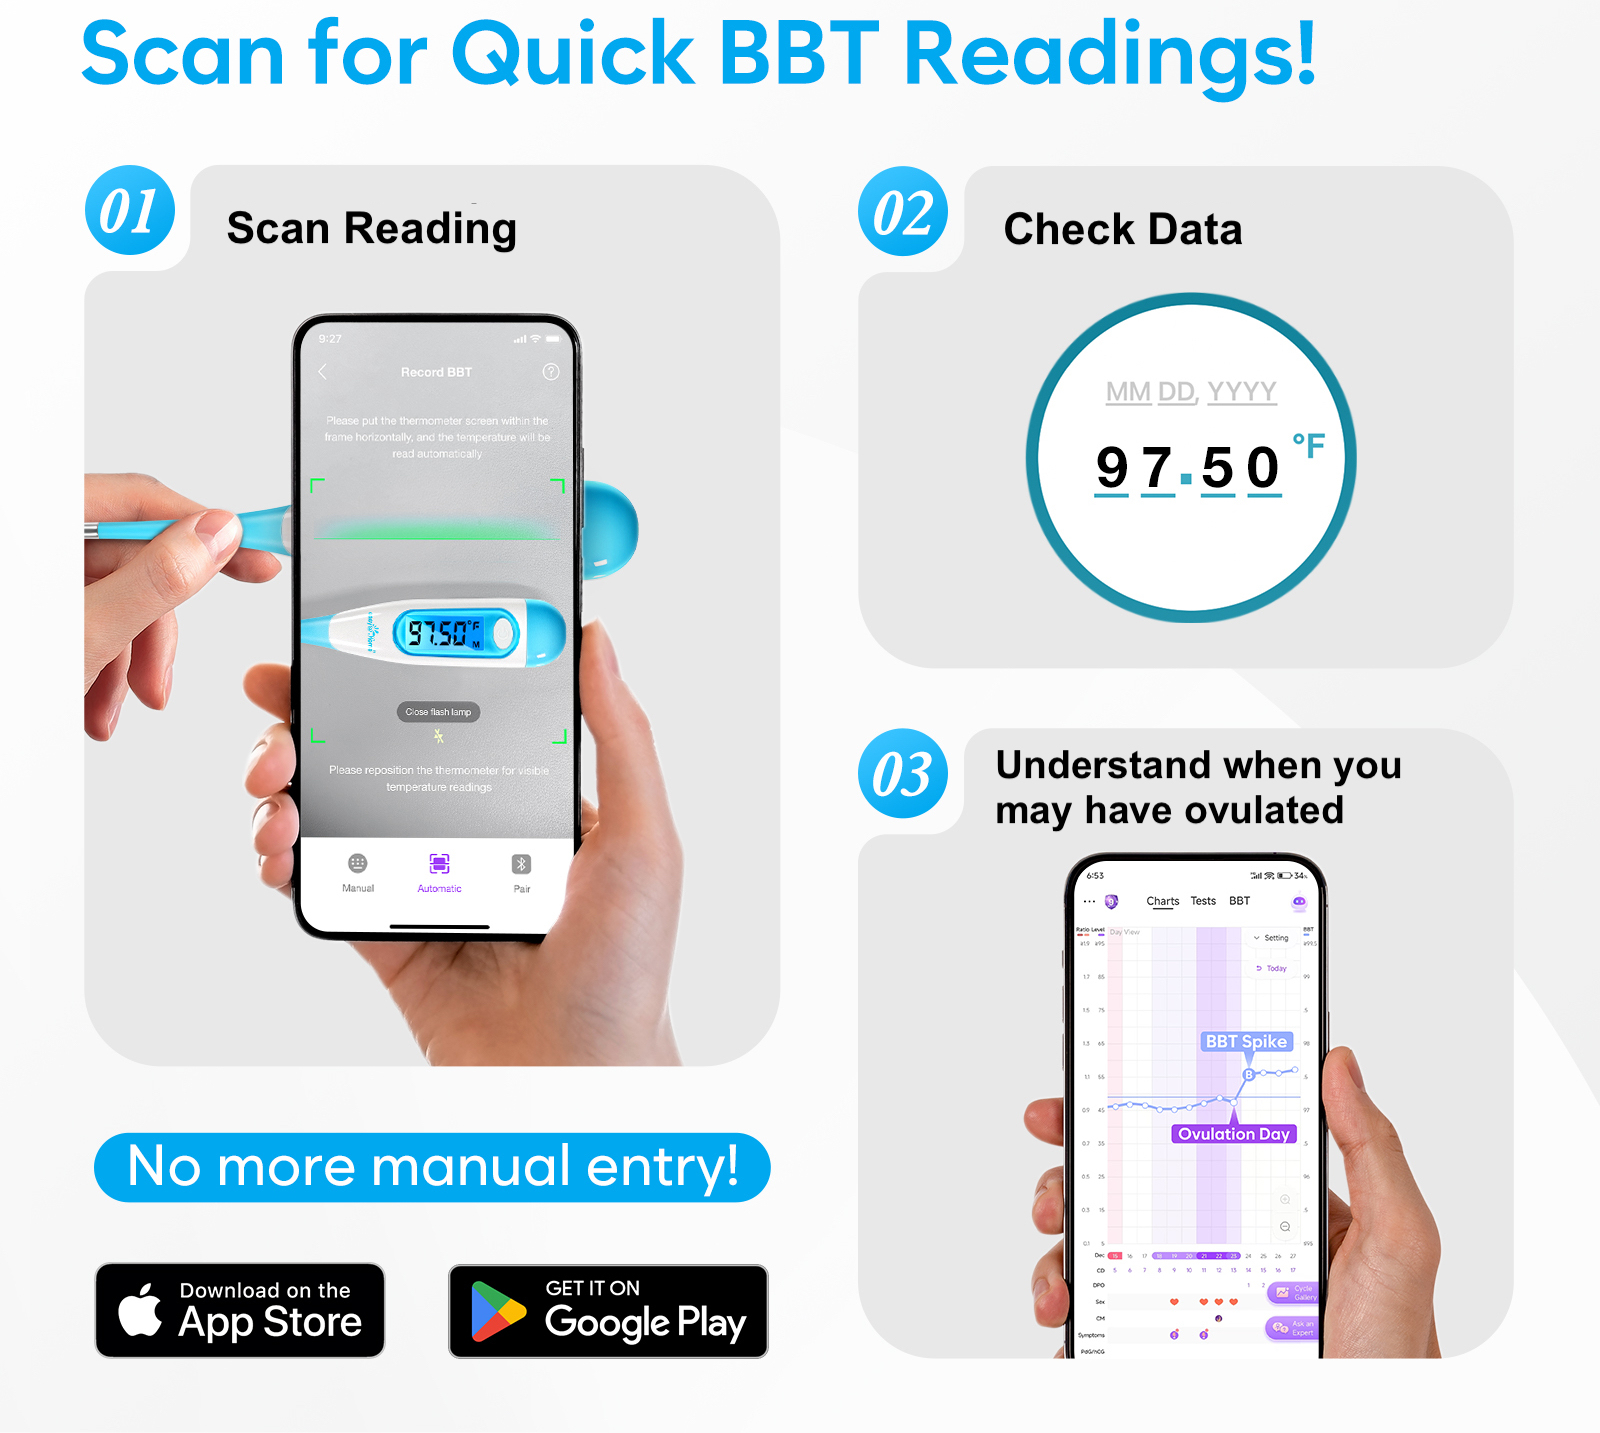
Tracking your BBT is simple with the Premom app. You can log your readings in two ways:
- Automatic Syncing with a Smart Thermometer: If you have the Premom smart basal thermometer or Easy@Home Smart Bluetooth-enabled basal thermometer, your temperatures will automatically sync with the app. No manual entry required!
- BBT AutoScan – A Revolutionary New Feature: Don’t have a smart thermometer? No problem! With Premom’s new BBT AutoScan, you no longer need to manually upload your temperatures. Simply use the app’s scanning technology to capture your temperature reading directly from your thermometer—quick and hassle-free.
The Premom app can track ovulation even when BBT spike patterns vary widely, thanks to its advanced AI algorithm for fertility awareness.
One of the trickiest parts of charting BBT is spotting that exact temperature shift that signals ovulation (BBT spike). That app removes the guesswork by automatically calculating and drawing the coverline once enough consistent data is recorded.
To generate a coverline, the app looks for certain criteria to be met:
- The first 6 consecutive temperatures should be lower than the next 3 consecutive temperatures, often referred to as the “6 low, 3 high” pattern.
- The difference between the highest temperature among the previous 6 temperatures and the lowest temperature among the next 3 should be equal to or greater than 0.5°F (0.2℃).
For the most accurate results, aim to record at least nine consecutive temperatures. Whether you use a smart thermometer for automatic syncing or the BBT AutoScan feature, the Premom app makes tracking your fertility straightforward and reliable.
How to Use a Basal Thermometer
A basal thermometer is a highly sensitive thermometer designed to detect tiny changes in your body’s resting temperature—shifts as small as one-tenth of a degree—that reveal when ovulation has occurred. As opposed to a regular thermometer, basal thermometers provide the precision needed for fertility charting. For basic use, take your temperature immediately upon waking, before getting out of bed, and record it daily.
Some basal thermometers will automatically sync your temperature to an app like the Easy@Home digital smart basal thermometer. This makes tracking your basal temperature as easy as 1, 2, 3!
7 BBT Tracking Tips to Get Started
To ensure accuracy, here are 7 tips for BBT tracking:
1. Take your temperature every day
BBT tracking depends on consistent, daily data, so in order to see the big picture, look for those 6 lows followed by 3 highs! Extra tip: Turn on the BBT reminder in your app so you don’t forget!
2. Temp at the same time every day BEFORE you get out of bed
Since BBT is your body’s resting temperature, you need to take it immediately upon waking before getting out of bed, talking, etc. Aim to take it at the same time each morning because even more than half an hour time difference can affect your results (and we’re talking about measurements in tenths of a degree!)
3. Get at least 3 hours of uninterrupted sleep
Make sure you have enough Zs to reach that “resting temp.”
4. Keep temping each cycle
Allow some time for you to get the hang of it and for the app to get to know your patterns. You’ll soon begin to see a pattern that will help you predict ovulation for future cycles.
5. Take a pregnancy test after 15 high temperatures
Did you know that your ovulation confirmation tool can also help predict pregnancy? If you found your BBT spike and have had 15 high temps above the coverline, it’s time to take a pregnancy test!
6. Let Premom do all the work for you
The Premom app will graph your temperatures, identify your BBT spike, and create your coverline so you can easily identify ovulation success.
7. Get the Easy@Home smart basal thermometer
Our EBT-300 model BBT thermometer syncs to the Premom app via Bluetooth and will automatically input your temps for you. Simply take your temperature and then check your chart!
Tracking your BBT is so worth it during your fertility journey, so what are you waiting for?